
Malware Samples - PMA Chapter 10
28 Feb 2026
The behavior of malware that operate in the kernel space, such as rootkits, is not observable with user-level dynamic analysis tools like OllyDbg. To analyze malicious drivers and other kernel-level malware dynamically, a debugger must be used that can be attached to the OS itself. Chapter 10 of Practical Malware Analysis covers the use of WinDbg to accomplish this analysis.
The book uses a Windows XP VM for these labs, but I opted to use Windows 10 which requires a different setup that I covered in this write-up. In addition to this setup, I also needed to run the following command in order to load unsigned drivers:

Also, the Window 7 drivers for samples 1 and 3 from the PMA GitHub repo had to be used.
Samples:
Malware Sample 1
This sample includes an executable and a driver which must be placed in C:\Windows\System32.
Questions:
- Does this program make any direct changes to the registry? (Use procmon to check)
- The user-space program calls the ControlService function. Can you set a breakpoint with WinDbg to see what is executed in the kernel as a result of the call to ControlService?
- What does this program do?
Does this program make any direct changes to the registry? (Use procmon to check)
There are no observable changes to the registry in procmon. At first I thought that maybe something had gone wrong because I am using Windows 10 and the updated Windows 7 malicious driver, but there are registry changes visible using RegShot:
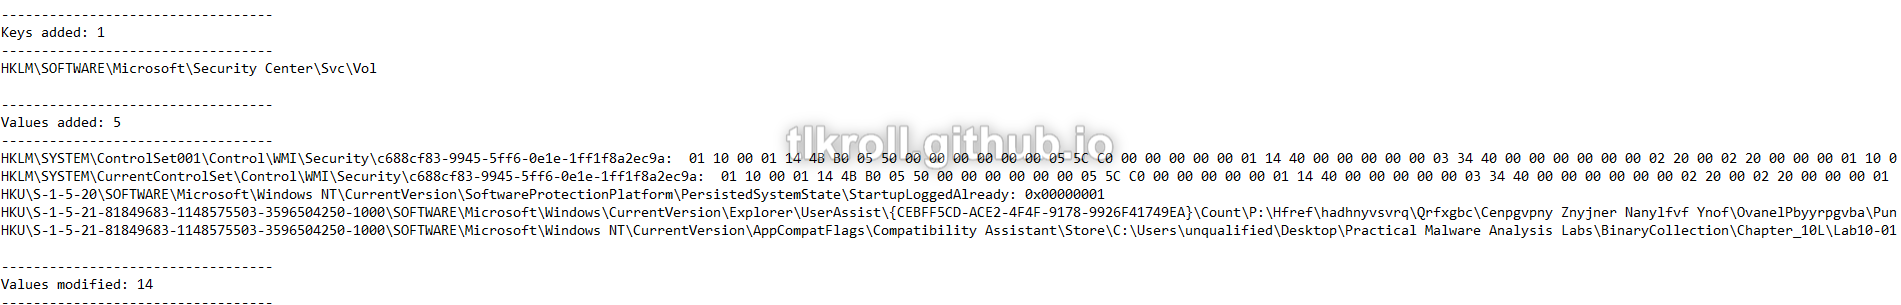
I believe the point of this question (and the instruction to use procmon specifically) is to demonstrate that malicious drivers can perform operations that will be invisible to procmon.
The user-space program calls the ControlService function. Can you set a breakpoint with WinDbg to see what is executed in the kernel as a result of the call to ControlService?
This sample includes an executable and a driver. Looking at the executable in IDA doesn't reveal much. It uses the driver to create a service and then start it. Next, ControlService is called with 1 as the dwService parameter, which stops the service:
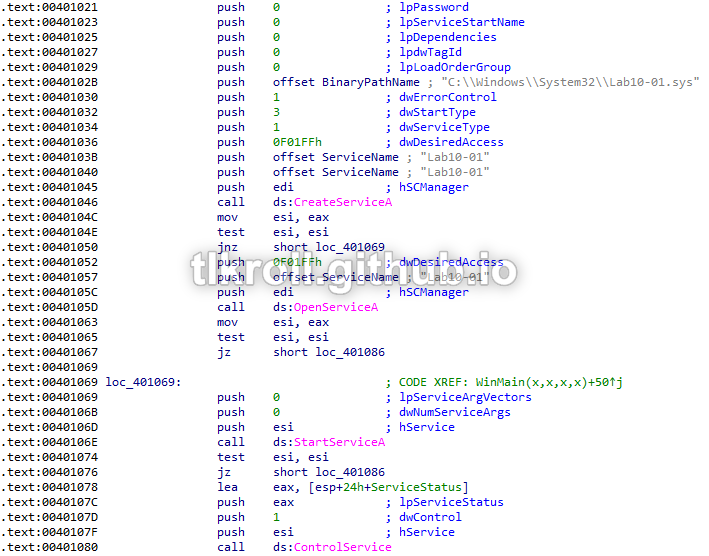
Nothing happens within the executable between starting the service and stopping it, which means that anything interesting is being performed with the driver at the kernel level.
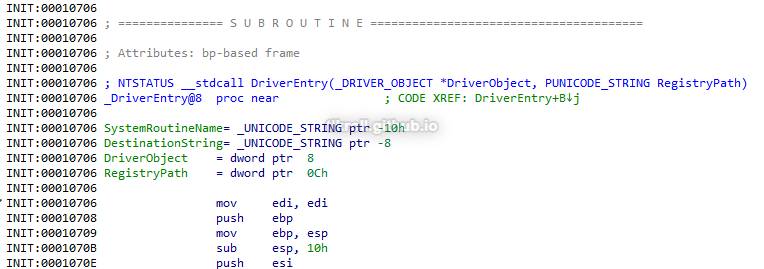
Looking at the driver in IDA, there is also nothing suspicious going on in DriverEntry:
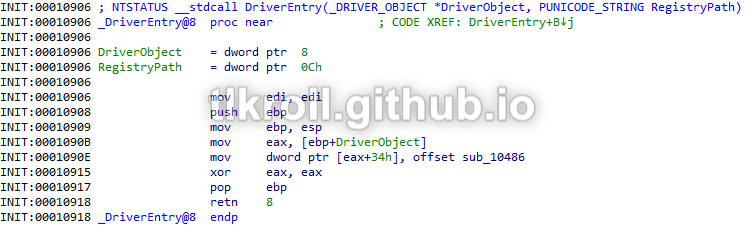
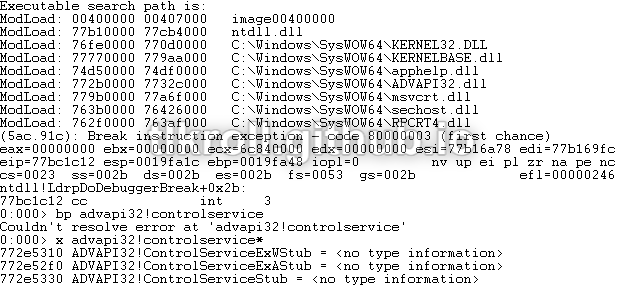
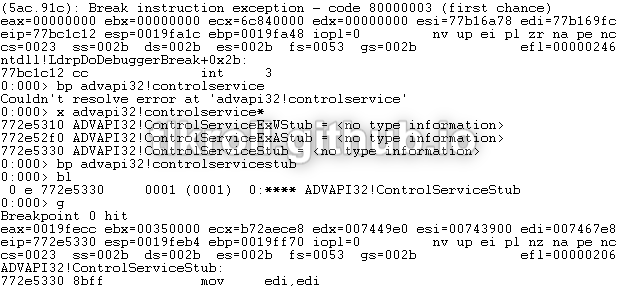
Since there is nothing obvious happening within the main code of the driver, let's see what happens when ControlService issues the command to stop. This will require two instances of WinDbg; one in user-mode inside the VM to debug the executable and a second outside the VM to debug the kernel-mode execution of the driver. Trying to set a breakpoint on ControlService resulted in a "couldn't resolve" error because a stub function is being called instead of a call straight to ADVAPI32. The actual name can be discovered using the x command and a wildcard:
Now, a breakpoint can be set on ControlServiceStub and execution can be resumed:
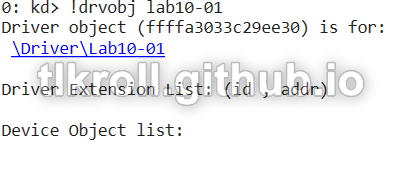
After hitting the user-mode breakpoint, the second instance of WinDbg can be started. First, execution must be broken and then the driver object can be found using the !drvobj command:
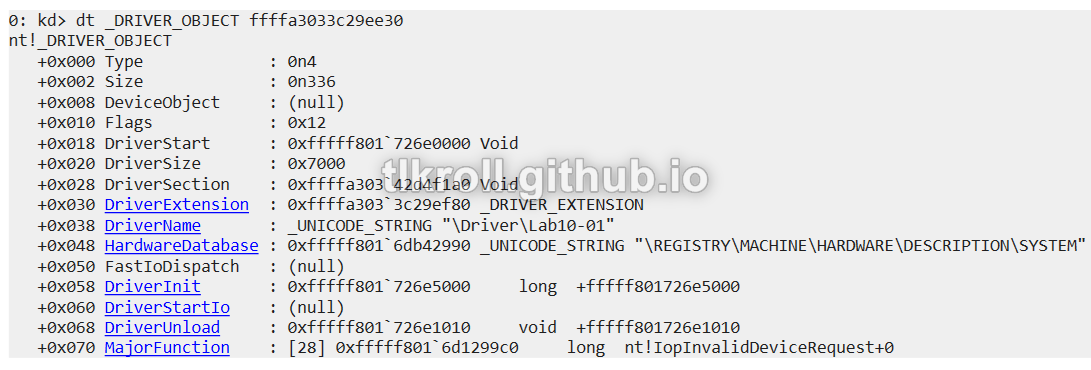
Now that the memory location of the object is known, the details can be viewed with dt _DRIVER_OBJECT:
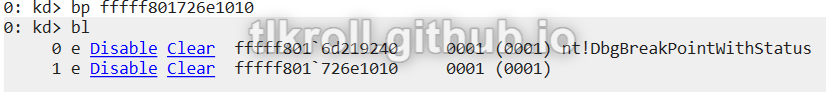
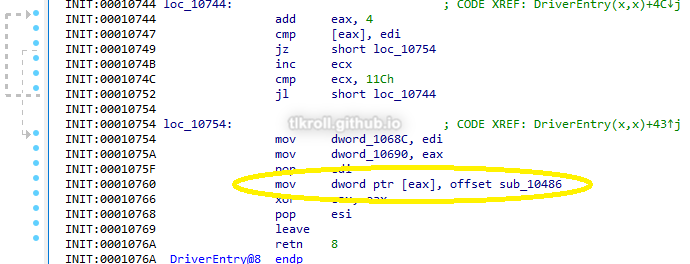
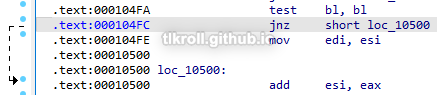
Since the goal is find out what happens when the stop command is issued, I set a breakpoint for the location of DriverUnload so that the code can be stepped through:
After resuming execution on both WinDbgs, several unknown calls are made:
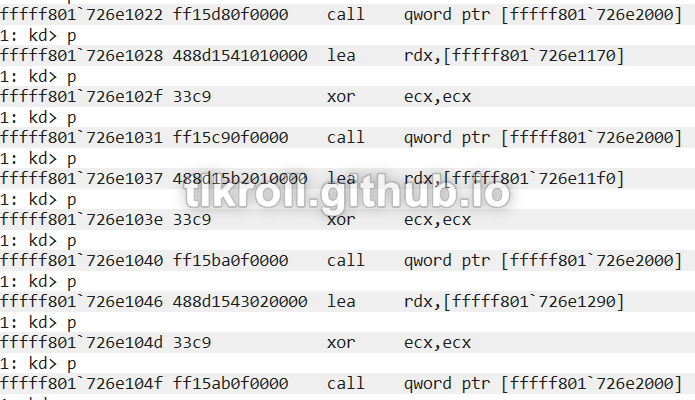
To locate these calls in the static disassembly, I loaded the driver into IDA manually specifying a base using the DriverStart address found earlier with dt _DRIVER_OBJECT and jumped to the first call at 0xfffff801726e1022:
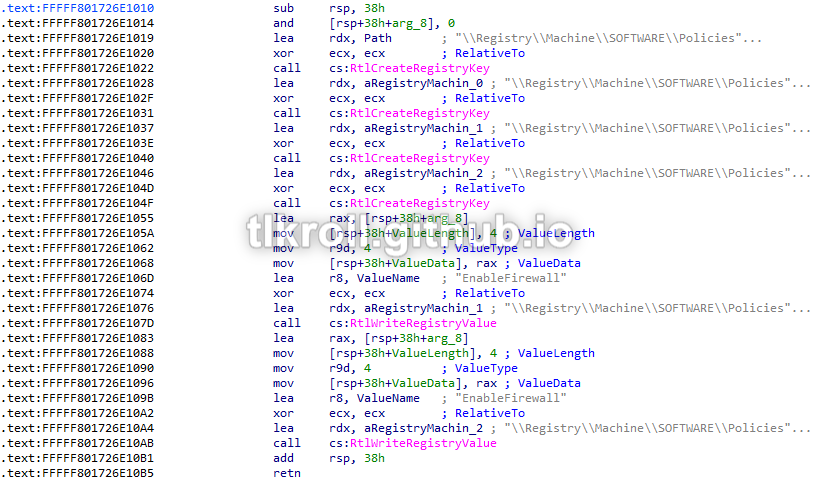
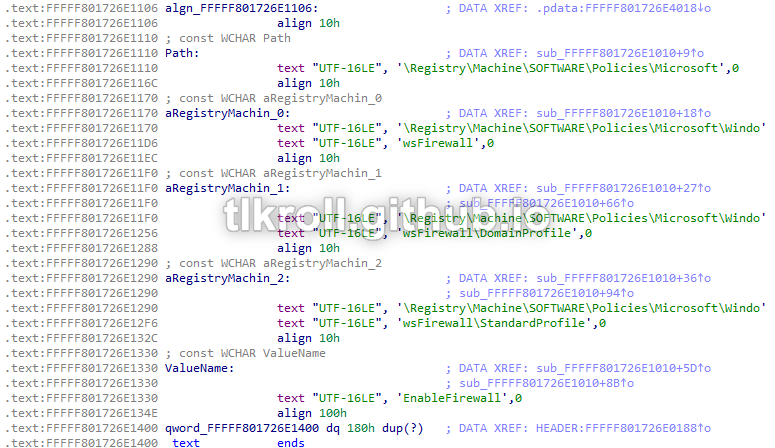
Now we're getting somewhere! There are a series of calls creating registry keys and writing values. Checking the values that are written, it writes 0 to the values for the DomainProfile, StandardProfile, and base WindowsFirewall keys, disabling the firewall entirely:
What does this program do?
This program creates and starts a service using a malicious driver and then immediately stops it and terminates execution without performing any other actions. There is also no malicious code within the main DriverEntry section. However, upon unloading the driver it writes values to the registry which disable Windows Firewall. By performing these actions using a driver from within the kernel space, the need for administrator privileges is avoided and the process is invisible to user-mode applications.
Malware Sample 2
This sample only includes an executable, but creates a driver dynamically.
Questions:
- Does this program create any files? If so, what are they?
- Does this program have a kernel component?
- What does this program do?
Does this program create any files? If so, what are they?
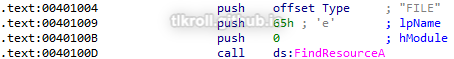
The first call made in this sample is to FindResourceA with 0 as the hModule parameter, which searches the resources section of the current process, and FILE as the lpType parameter, indicating there is a file embedded within the resource section of this binary:
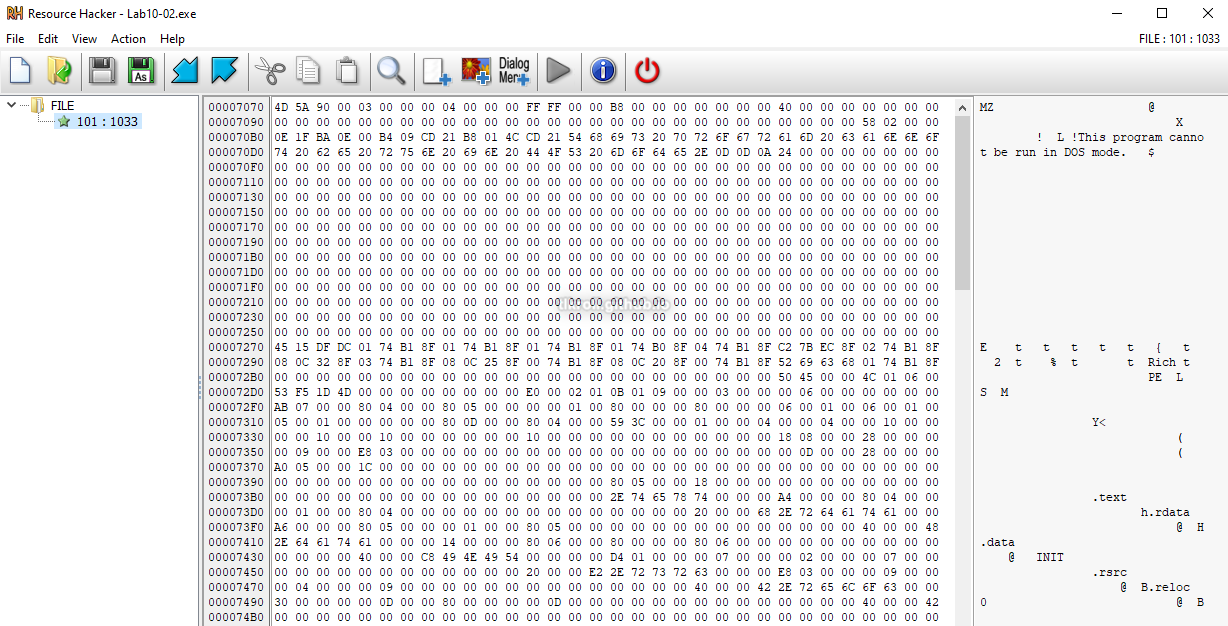
When opened in Resource Hacker, evidence of a PE header can be seen with a quick glance at the hex editor:
After exporting the resource as a binary it can then be viewed in IDA. The entry point is labeled as DriverEntry, which means this is a driver:
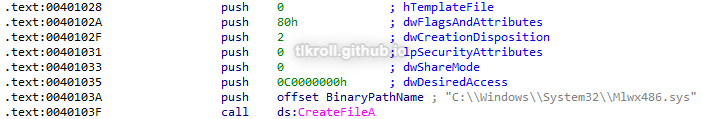
Back to the executable; after finding the resource, it is then loaded with LoadResource and written to C:\Windows\System32 as a file named Mlwx486.sys:
Does this program have a kernel component?
Taking a closer look at the driver embedded in the resource section of the executable, it begins by initializing a unicode string. I needed to look at IDA's hex view to see the complete value:
Next, MmGetSystemRoutineAddress is called twice; once with NtQueryDirectoryFile and again with KeServiceDescriptorTable:
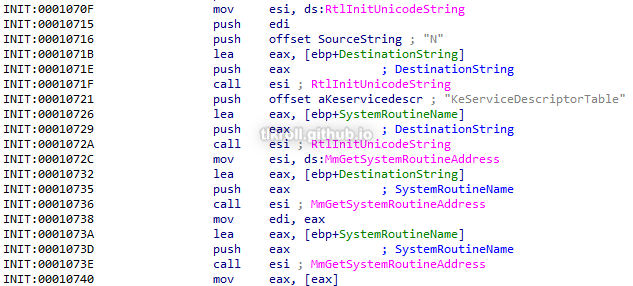
KeServiceDescriptorTable is the kernel structure where pointers to system calls are stored. NtQueryDirectoryFile is a Windows function that returns file information. After locating these in memory, there is a loop that iterates over the KeServiceDescriptorTable structure until it locates NtQueryDirectoryFile. After locating the function, the loop is broken and a function from within this program is moved into that location, replacing the system call:
The replacement function begins by performing NtQueryDirectoryFile as normal. If only one file is returned, execution jumps to the end of the function and NtQueryDirectoryFile's normal return value is used. However if multiple files are returned such as when obtaining a list of files in a directory, a comparison is performed between the first 8 bytes of each file's information at offset 0x5E (file name) and a string stored in the .text section:
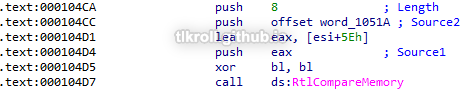
This is a UTF-16 string, which is 2 bytes per character, meaning the first four characters of the string are compared to the file name:
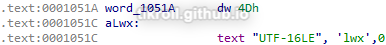
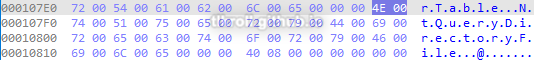
Looking at the raw hex, those characters are Mlwx. This routine checks to see if the file name being returned by NtQueryDirectoryFile matches the Mlwx486.sys driver that was written to C:\Windows\System32:

If there is a match, bl is incremented and the instruction that adds the file's information to the FileInformation structure that NtQueryDirectoryFile returns is skipped, excluding it from the results:
What does this program do?
This program extracts a binary from its resources section which is then used to write a driver to C:\Windows\System32. That driver is then used in the creation of a new service which hooks system calls to NtQueryDirectoryFile and replaces them with code that will hide the malicious driver from directory listings. I like to run these samples and analyze the results to verify my findings, but unfortunately the service creation failed for me on both Windows 7 and Windows 10.
Malware Sample 3
Questions:
- What does this program do?
- Once this program is running, how do you stop it?
- What does the kernel component do?
What does this program do?
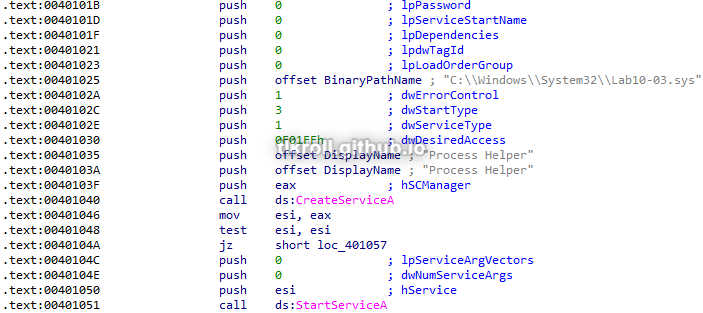
First, this program creates and starts a service named Process Helper using the malicious driver:
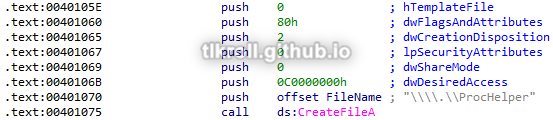
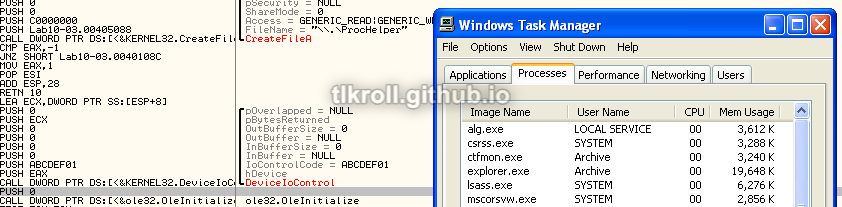
Next, it uses CreateFileA to create a device named \\.\ProcHelper:
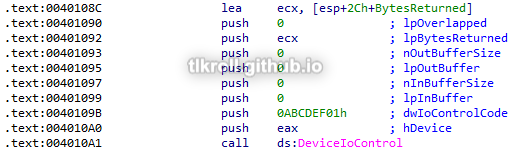
After creating the device, DeviceIoControl is called to send it a control code of 0xABCDEF01 and the output of that operation is directed to the local variable IDA has named BytesReturned:
Now, OleInitialize is called followed by CoCreateInstance, which creates a handle to a Windows COM object. The rclsid parameter passed to the call belongs to Internet Explorer:
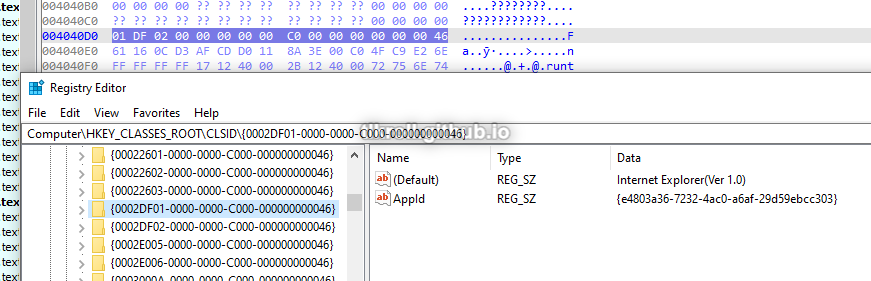
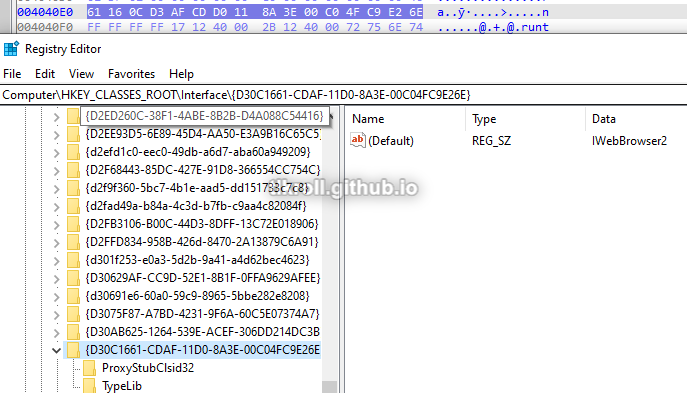
The riid parameter points to the IWebBrowser2 interface. These values are a bit tricky to find in the registry because the leading 4 bytes are used for the first section and the endianness is swapped:
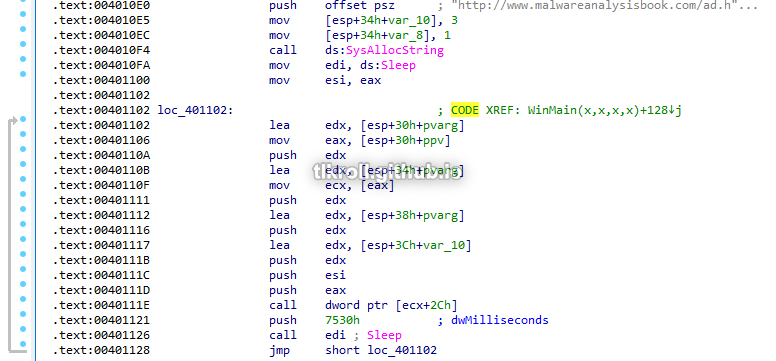
Finally, the string http://www.malwareanalysisbook.com/ad.html is initialized and passed as an argument to the function at offset 0x2C in the IWebBrowser2 interface, followed by Sleep being called for 30 seconds. These calls are inside a loop with no exit:
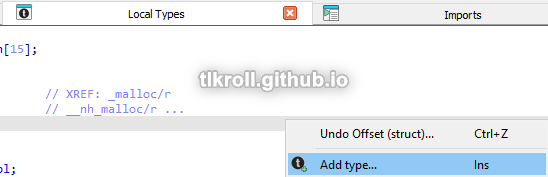
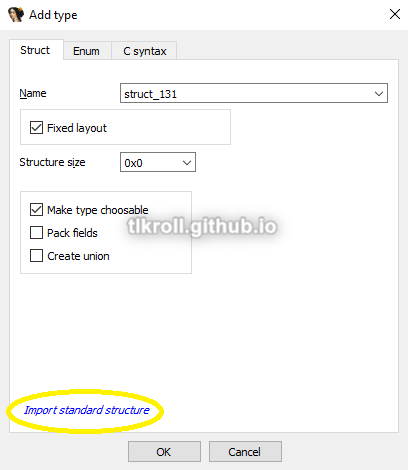
It isn't obvious what functions are being called from a COM object just by looking at the disassembly. One method for finding these functions involves locating the IWebBrowser2 vtable in Microsoft's exdisp.h header file and navigating to the calculated offset, which I documented when analyzing this sample. Another method is adding the vtable as a structure in IDA. To add the IWebBrowser2 vtable to IDA so that it will show the parameter names, first go to the Local Types tab, right click, and click on Add type...:
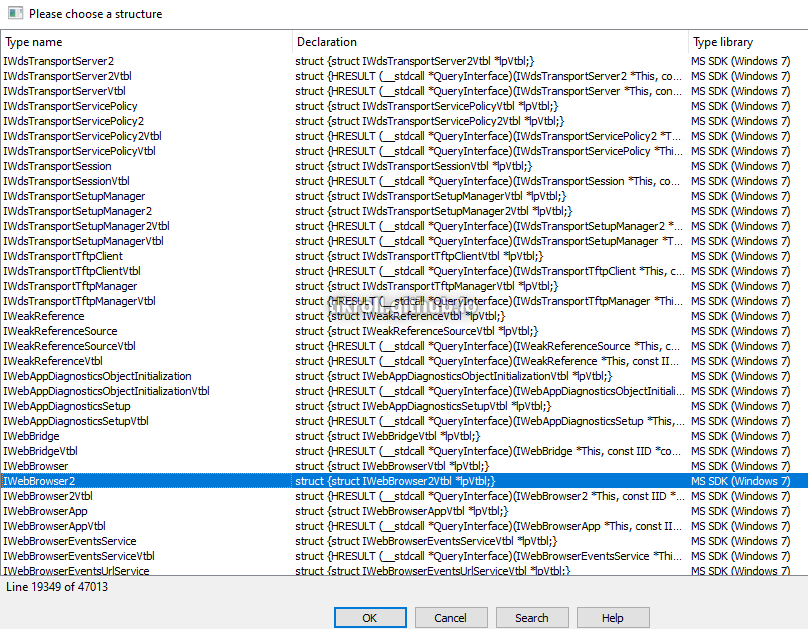
Then, click on Import standard structure:
Now select the IWebBrowser2 interface (you can type to search):
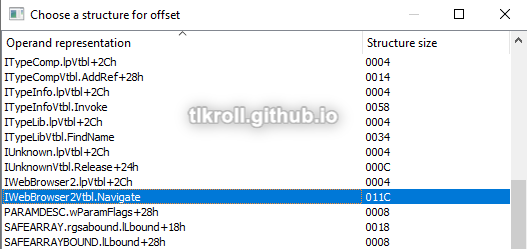
Finally, select the call instruction with the unknown offset and press T. Sorting by the name of the structure and scrolling down to IWebBrowser2, the offset and function name can be seen:
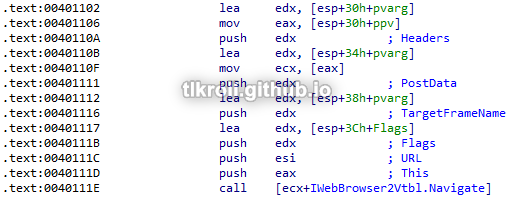
Selecting the function will also fill in all the parameter names:
This program creates and starts a service from a driver, then creates a device to which it sends an unknown command. Following that, it navigates to http://www.malwareanalysisbook.com/ad.html every 30 seconds indefinitely.
Once this program is running, how do you stop it?
This program starts a service using a malicious driver and then enters an endless loop of IWebBrowser2 Navigate commands. To completely stop the program, the execution must be terminated and the Process Helper service should be stopped. However, once the loop is reached the process is no longer visible in Task Manager. Stepping through the execution with OllyDbg the process can be seen just before DeviceIoControl is called:
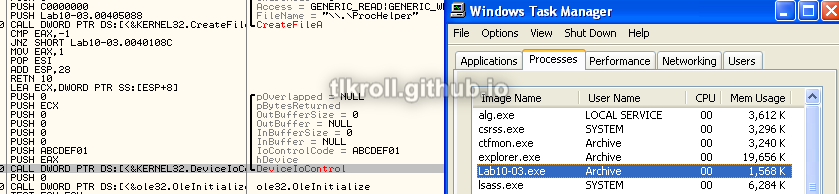
After the call, the process disappears from the list even though execution continues:
This means the device driver is somehow hiding the process from view and when execution has reached this point it cannot be stopped without rebooting.
What does the kernel component do?
Fortunately, WinDbg was a little more cooperative with this sample and I was able to set a breakpoint on DeviceIoControl:

After hitting the user-mode breakpoint within the VM, the driver can be examined in the kernel-mode instance on the host machine. However, the !drvobj with the name of the driver file returns nothing:
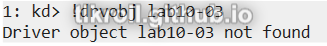
But remember that a device named ProcHelper was created with CreateFileA, the handle to which was used in the DeviceIoControl call. Here, the !devobj command can be used instead:
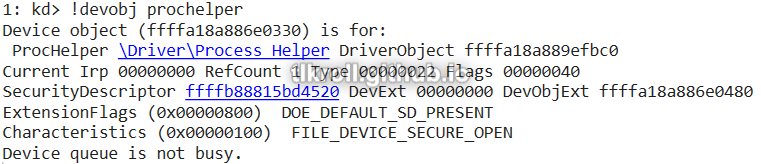
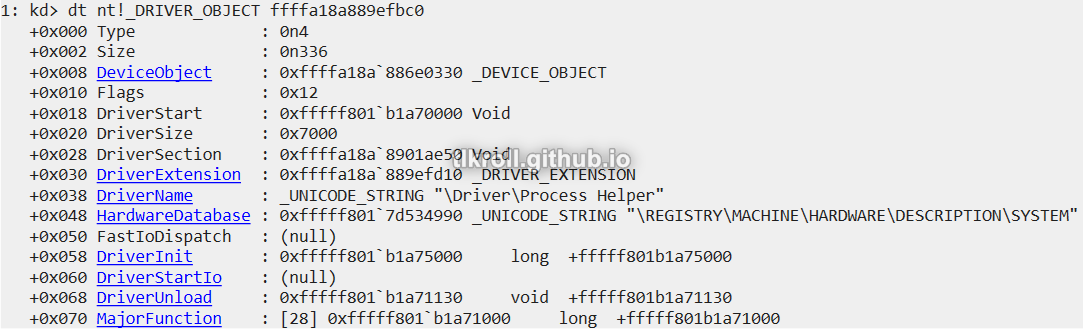
Now dt nt!_DRIVER_OBJECT can be used with the driver object address that was returned for that device:
Using the dq command to display data from memory in quad-word form (since this is the 64-bit driver) along with object base address plus the offset to MajorFunction returns a list of function addresses (L1C returns 0x1C results):
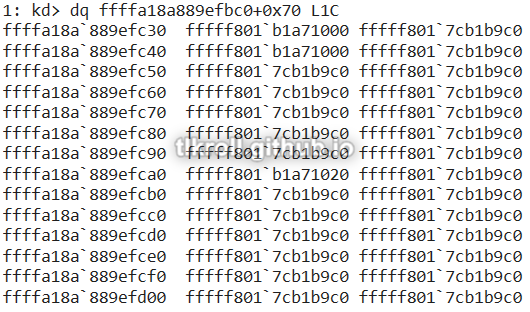
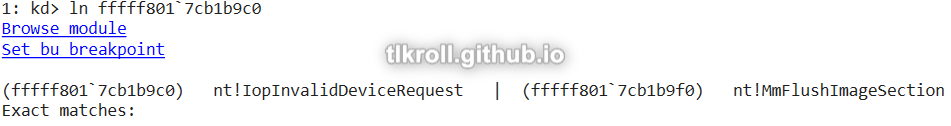
Only three functions were shown in MajorFunction. Most were at 0xfffff8017cb1b9c0, which is just error handling:
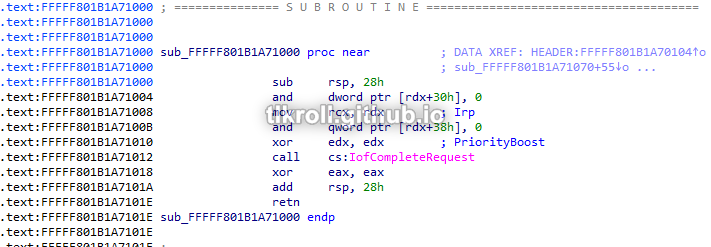
The ln command was not useful for the other functions because they are defined within the object and have no associated labels. The best option at this point is to manually load the driver in IDA with the same base address as the DriverStart address 0xfffff801b1a70000 obtained from the dt nt!_DRIVER_OBJECT call earlier. The only call within the first function at 0xfffff801b1a71000 is to IofCompleteRequest, which runs any routine specified by the Irp parameter upon request completion:
Setting a breakpoint on that function does not yield any results before crashing, so this function is never reached. This may be due to the fact that this sample crashes before completing requests on 64-bit systems, but this function still does not appear to do anything malicious. However the opportunity exists to pass a malicious function pointer to IofCompleteRequest and this knowledge may be useful in the future.
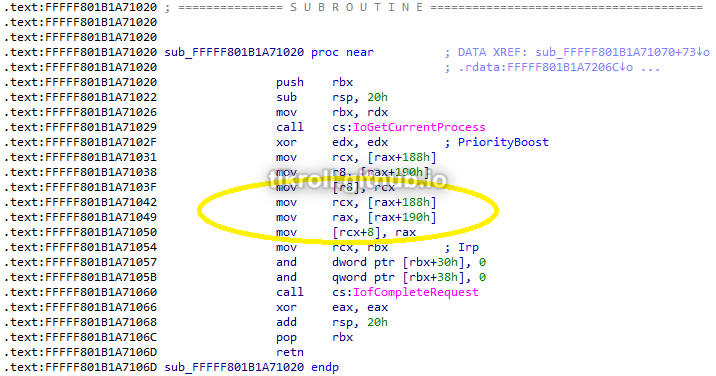
The final function at 0xfffff801b1a71020 does have some code worth looking at. This function gets the address of the current process and rewrites some values at two offsets from that address. These offsets are meant to point into the ActiveProcessLinks structure of the current process. Because each process is sized differently there is no way to track processes using fixed offsets. The solution to this in Windows is storing pointers to the next process and previous process in the ActiveProcessLinks structure of each process, which forms a circular double-linked list between all the running processes. The offset to this structure varies widely depending on Windows version. This driver was written for Windows 7 and results in a crash on my Windows 10 VM. I posted a solution to this issue in this write-up.
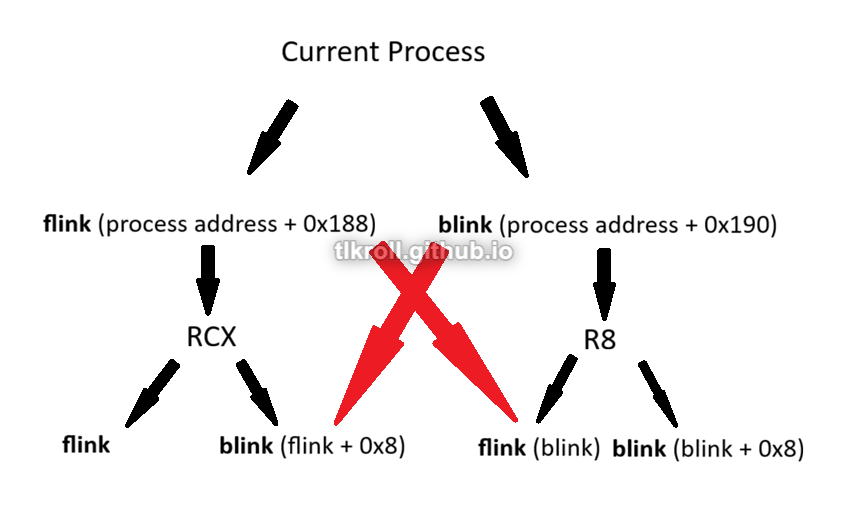
In Windows 7, the ActiveProcessLinks structure is located at the offset 0x188 from the process address. The structure is a list of just two items: flink (forward link) and blink (back link). The first part of this function stores flink in RCX. Adding 8 to that address results in a pointer to blink, which is stored in R8:
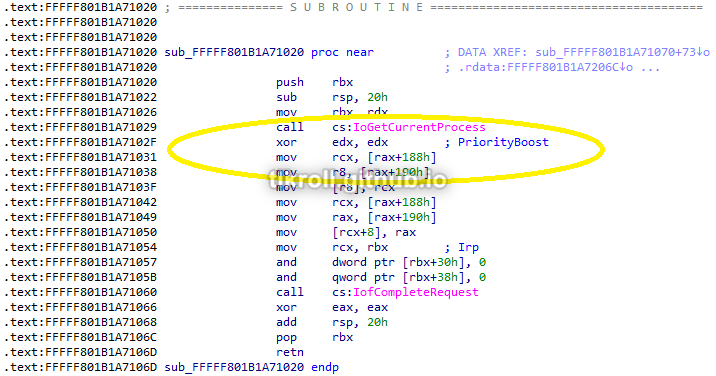
Next, the flink for the current process is moved into the flink for the previous process, overwriting the address of the current process. Then, the address of flink is moved into RCX and blink is moved into RAX. The address of blink is written into flink + 8, which is the blink of that process. What this does is overwrite references to the current process in the ActiveProcessLinks structures of the adjacent processes, removing the current process from the linked list. This is the routine that hides the malicious process from view:
It's difficult to understand this process without visualizing it. Each process has its own flink and blink. The process ahead of the current process holds a pointer to the current process in its blink. The process behind the current process holds a pointer to the current process in its flink. The red arrows in this graphic try to illustrate where the overwrites are occurring:
Conclusion
This has definitely been the most intense chapter yet. WinDbg had a steep learning curve alone, which was followed by learning the concepts behind kernel debugging. I learned a lot about Windows internal structures and how kernel-level drivers can manipulate them. I even got a chance to use WinDbg to actually debug the Windows 7 driver included with the PMA labs and troubleshoot why it wasn't working on Windows 10. This was an excellent learning experience and I'm sure I will be referencing this write-up many times in the future!